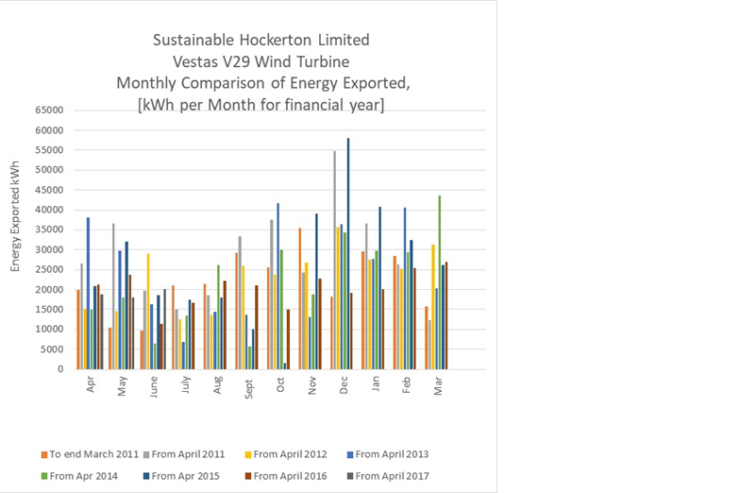
We monitor the output from the turbine closely to spot how its performing. This graph shows how the natural variation in wind changes the output month by month, year by year.
We monitor the output from the turbine closely to spot how its performing. This graph shows how the natural variation in wind changes the output month by month, year by year.